
Creating an ESG sustainability report for XXX shipping company involves following a structured methodology to ensure comprehensive coverage of relevant aspects. Here’s a step-by-step guide to creating an effective ESG sustainability report for XXX
1. Commonly used frameworks include the Global Reporting Initiative (GRI), Sustainability Accounting Standards Board (SASB), Task Force on Climate-related Financial Disclosures (TCFD), and the UN Global Compact.
2. Communication and dissemination: We undertake the development of a communication strategy to effectively share the report with stakeholders.
3. Velticon monitors progress and update: Sustainability reporting is ongoing. Regularly monitor and measure progress against the set goals and targets, update the data, and continuously improve the reporting practices based on feedback We determine which aspects of the XXX shipping company’s operations and performance will be covered in the report, such as emissions, waste management, labour practices, community engagement, etc.
4. We collect relevant data from various internal sources, such as operational records, financial statements, and human resources records.
5. We determine the key ESG indicators that align with the shipping industry and are relevant to XXX company’s sustainability goals. We ensure the indicators are specific, measurable, achievable, relevant, and time-bound.
6. We use quantitative and qualitative analysis techniques to identify strengths, weaknesses, trends, and areas for improvement. We consider benchmarking against industry peers to gain additional insights.
7. Velticon set targets and goals: Based on the assessment, establish realistic targets and goals that align with XXX company’s sustainability strategy. These targets should be specific, measurable, and time-bound. Aim for continuous improvement and align the goals with relevant international frameworks, such as the United Nations Sustainable Development Goals (SDGs).
8. Apply reporting guidelines: We follow recognized reporting frameworks and guidelines to enhance the credibility and comparability of the report and changing industry standards
The sustainability report should reflect the specific circumstances and priorities of your shipping company, and it should be tailored to address the unique challenges and opportunities within the industry.
International shipping emitted nearly 700 million metric tons of carbon dioxide (MtCO₂) into the atmosphere in 2021. Annual international shipping emissions have doubled since 1990, reaching a record high of 701.9 MtCO₂ in 2017. Bulk carriers are the biggest contributor to shipping emissions, with the global fleet emitting an estimated 440 MtCO₂ in recent years.
Performance indicators (PIs) for shipping are metrics used to measure the efficiency, safety, and effectiveness of shipping operations and vessels. These indicators help shipping companies, maritime authorities, and stakeholders assess various aspects of shipping performance to ensure compliance, identify opportunities for improvement, and enhance overall operational efficiency.
Here are some common performance indicators for shipping and how to calculate them:
1. Fuel Efficiency:
• Fuel Efficiency = Distance Traveled (nautical miles) / Fuel Consumed (tons or liters)
2. Energy Efficiency Operational Indicator (EEOI):
• EEOI = (Total Fuel Consumption / Distance Traveled) * Cargo Carried (in tonnes) / 1000
3. CO2 Emissions:
• CO2 Emissions = Fuel Consumed (tons or liters) * CO2 Emission Factor (per fuel type)
4. Time Charter Equivalent (TCE) Revenue:
• TCE Revenue = Total Voyage Revenue – Voyage-related Costs (e.g., bunker fuel, port fees)
5. Revenue per Available Day:
• Revenue per Available Day = Total Voyage Revenue / Number of Available Days
6. Gross Tonnage (GT) Utilization:
• GT Utilization = (Total Cargo Carried / Total Cargo Capacity) * 100
7. Vessel Turnaround Time:
• Vessel Turnaround Time = Departure Time – Arrival Time
8. Port Turnaround Time:
• Port Turnaround Time = Departure Time from Port – Arrival Time at Port
9. Lost Time Injury Frequency (LTIF):
• LTIF = (Number of Lost Time Injuries / Total Hours Worked) * 1,000,000
10. Environmental Performance Index (EPI):
• EPI = Environmental Score / Voyage Distance
These performance indicators provide valuable insights into the operational efficiency, environmental impact, and safety performance of shipping operations. To calculate these indicators, shipping companies need to collect and analyze relevant data, such as fuel consumption, cargo carried, voyage revenue, operational hours, and safety incidents. Regularly monitoring and evaluating these indicators can help shipping companies optimize operations, reduce costs, and enhance their environmental sustainability efforts. Contact us for shaping the corresponding database and the statistical modelling as calculated by Mar2Invest.
In the context of shipping and maritime operations, both PIs (Performance Indicators) and KPIs (Key Performance Indicators) are used to measure various aspects of performance. However, there is a difference between the two:
- Performance Indicators (PIs): Performance indicators, or PIs, are a broader set of metrics used to evaluate the performance of different aspects of shipping operations. They provide valuable information about the efficiency, safety, and effectiveness of various processes and activities within the shipping domain. PIs may cover many measurements, including fuel efficiency, cargo handling, safety incidents, environmental impact, vessel utilization, and more. PIs help shipping companies assess specific performance areas and identify opportunities for improvement.
- Key Performance Indicators (KPIs): Key Performance Indicators, or KPIs, are a subset of PIs that are strategically selected as the most critical metrics for measuring the overall performance and success of the shipping business. KPIs are closely aligned with the company’s strategic goals and objectives. They are essential for monitoring the organization’s performance and progress toward meeting its key targets and long-term objectives. KPIs are often used at higher levels of management for decision-making and strategic planning.
In summary, PIs are a broader set of performance metrics used to evaluate specific aspects of shipping operations, while KPIs are the most important metrics chosen strategically to measure the overall performance and success of the shipping company. KPIs provide a more focused and actionable view of the organization’s performance, allowing management to make informed decisions to drive success and improvement. PIs feed into the overall performance evaluation and help identify areas where specific action may be needed to improve KPI performance.
| The Shipping KPIs Standard is built up hierarchically with 3 different levels: | 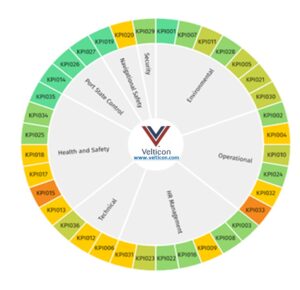 |

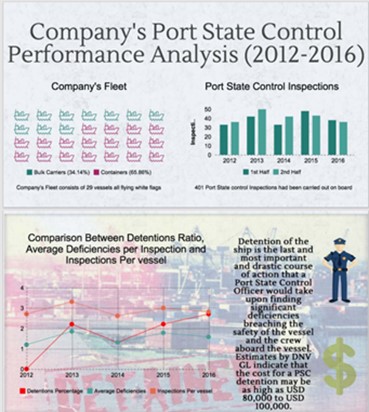
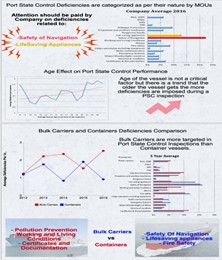
Company’s Port State Control Performance Analysis – Example
 |  |
KPIs (Key Performance Indicators) and ESG (Environmental, Social, and Governance) indexes are related in the sense that ESG indexes use specific KPIs to assess the environmental, social, and governance performance of companies or organizations. ESG indexes are designed to measure and compare the sustainability and responsible business practices of companies in various industries. These indexes help investors and stakeholders evaluate the companies’ performance based on their commitment to environmental stewardship, social responsibility, and good governance.
Here’s how KPIs are related to ESG indexes:
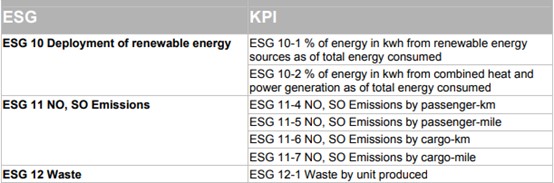
1. KPI Selection: ESG indexes typically select specific KPIs that align with the key ESG criteria. These KPIs may vary based on the industry and the specific ESG framework used by the index provider. For example, KPIs related to greenhouse gas emissions, energy efficiency, employee diversity, board diversity, and ethical business practices are commonly included in ESG assessments.
2. Data Collection: Companies participating in ESG indexes are required to disclose relevant data related to the selected KPIs. This data is then used to calculate the ESG scores of the companies. The KPI data allows Velticon to evaluate and rank companies based on their performance in environmental, social, and governance dimensions.
3. Scoring and Ranking: The data collected from the KPIs are analyzed and scored to create an ESG rating for each company. Depending on the ESG index methodology, each company is ranked relative to its peers, and the top-ranking companies are included in the ESG index.
4. ESG Index Construction: ESG indexes are constructed using a weighted combination of the individual ESG scores of the included companies. The weights assigned to each ESG dimension (environmental, social, and governance) can vary based on the index provider’s methodology and the preferences of investors.
All the above work should automatically be done by Mar2Invest ESG algorithms provided that we have developed the corresponding database for each client.
How Velticon calculates ESG-KPIs:
Calculating ESG-KPIs involves collecting and analyzing data related to specific ESG criteria. Here’s a general outline of the Mar2Invest process:
1. Data Collection: Companies disclose relevant data related to ESG KPIs, which can be obtained through sustainability reports, financial filings, or other public disclosures.
2. Normalization: Some KPIs may require normalization to compare companies of different sizes or in different industries. Normalization ensures that the data is standardized and comparable.
3. Weighting: Depending on the ESG index methodology, different weights may be assigned to each KPI based on its importance in measuring sustainability and responsible business practices.
4. Scoring: Companies are scored based on their performance on each individual KPI. The scoring may involve benchmarking against industry peers or absolute targets.
5. ESG Index Construction: The individual ESG KPI scores are aggregated, and companies are ranked and selected to be included in the ESG index based on their overall performance.
It’s important to note that different ESG index providers may have varying methodologies and KPIs, and the process for calculating ESG scores can differ among them. Additionally, as the field of sustainable investing and ESG analysis evolves, the selection and calculation of KPIs may be subject to changes and refinements
Example:
- Expert Guidance: Our team of ESG experts possesses extensive knowledge and practical experience in sustainability reporting. We stay updated on emerging trends, regulations, and frameworks to provide you with the most relevant and valuable guidance. Velticon’s team works closely with any Greenhouse Gas Emissions Industry unit i.e. land-based industries, energy organizations, shipping companies, aviation, road transport, rail, and pipeline. to develop tailored solutions.
- Tailored Solutions: We understand that every organization is unique. Our approach is customized to your specific needs, industry context, and stakeholder requirements, ensuring your ESG reporting aligns with your business strategy.
- Enhanced Credibility: By working with Velticon, you gain credibility and trust among investors, customers, and other stakeholders. Our rigorous verification processes and adherence to recognized standards enhance the reliability of your ESG disclosures.
- Efficient Resource Allocation: We help you optimize your resources by streamlining data collection, analysis, and reporting processes. Our expertise allows you to focus on core business activities while effectively managing your ESG responsibilities.
- Competitive Advantage: A well-executed ESG reporting strategy can differentiate your organization from competitors, attracting investors, customers, and top talent who value sustainable practices and transparency.
Ready to embark on your ESG reporting journey? Reach out to Velticon today and let our experts guide you toward sustainable success. Contact us and we will be delighted to discuss your specific needs and how we can assist you in achieving your ESG reporting objectives.
Remember, transparency, accountability, and sustainability go hand in hand. Join hands with Velticon, and together, let’s create a brighter, more sustainable future.